Our customer-focused business model has been a cornerstone of Southern Company's culture since our earliest days. We believe our ability to provide real solutions for customers translates to value creation for investors, as demonstrated by the results we have delivered over time.
Over the long term, Southern Company has been a solid investment, outperforming the S&P 500 over the 10-, 20- and 30-year periods ending December 31, 2015. Our dividend–an important part of that performance–increased for the 14th consecutive year in 2015, and we have paid shareholder dividends every quarter since 1948.
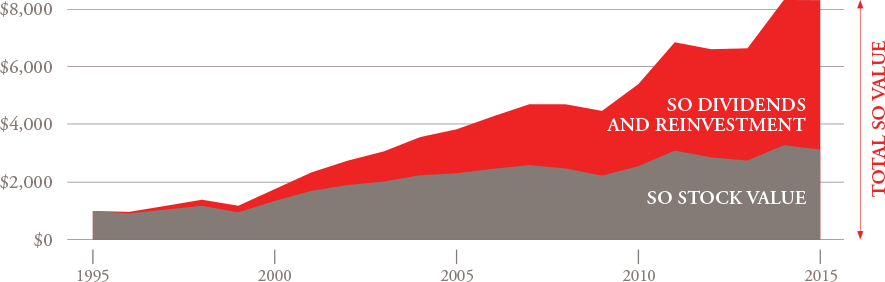
At year-end, Southern Company's dividend yield was 4.6 percent, compared with approximately 2.0 percent for the S&P 500. Over the past 20 years, dividends and dividend reinvestment have accounted for approximately 71 percent of the increase in our shareholder value, compared with approximately 39 percent of the increase in shareholder value for the S&P 500.
Another advantage for shareholders is low volatility relative to the market. In 2015, Southern Company was the least volatile stock in the Philadelphia Electric Utility Index. Stocks with low volatility are often less prone to price swings during times of market stress, and are therefore considered more stable.
Our steadfast commitment to customer value has been a driving force behind a steady increase in shareholder value–and we see no reason to alter that course.
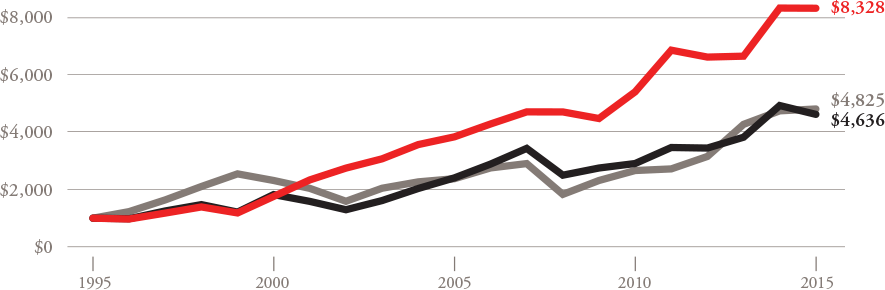
Source: FactSet and Bloomberg
See Glossary for information on total shareholder return.
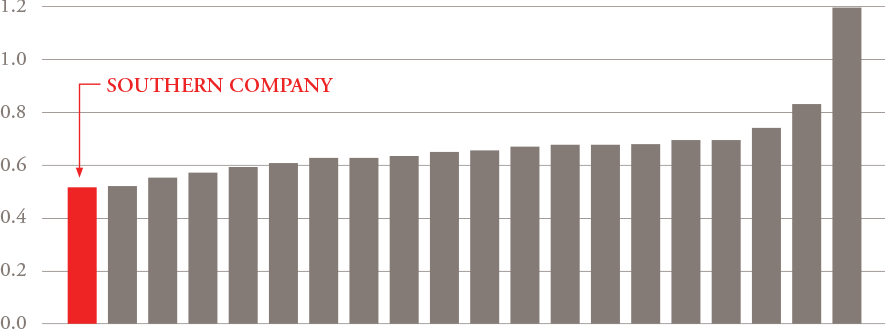
Source: FactSet and Bloomberg, five-year beta as of December 31, 2015
See Glossary for information on beta.
See Glossary for information on total shareholder return.