Throughout Southern Company’s history, an unwavering commitment to customers has been a cornerstone of our business. We believe keeping customers at the center of all we do ultimately translates to value creation for investors, and this has been borne out in the results we’ve delivered year after year.
Over the long term, Southern Company has proved to be a solid investment, outperforming the S&P 500 over the 10-, 20- and 30-year periods ended December 31, 2016. Our dividend—an important part of that performance—increased for the 15th consecutive year in 2016, and we have paid shareholder dividends every quarter since 1948.
At year-end, Southern Company’s dividend yield was 4.5 percent, compared with approximately 2.0 percent for the S&P 500. Over the past 20 years, dividends and dividend reinvestment have
accounted for approximately 69 percent of the increase in our shareholder value, compared with approximately 40 percent of the increase in shareholder value for the S&P 500.
Of course, dividends do more than simply provide cash to shareholders; they help shape a company’s approach to risk. Once again, the proof is in the numbers. In 2016, Southern Company was the second-least volatile stock in the Philadelphia Electric Utility Index. Stocks with low volatility are often less prone to price swings during times of market stress, and are therefore considered more stable.
Keeping customers first—along with stellar reliability and prices below the national average—has enabled us to sustain operational success, reinforcing our reputation for delivering exceptional long-term shareholder value.
SOUTHERN COMPANY
PHILADELPHIA ELECTRIC UTILITY INDEX
S&P 500 INDEX
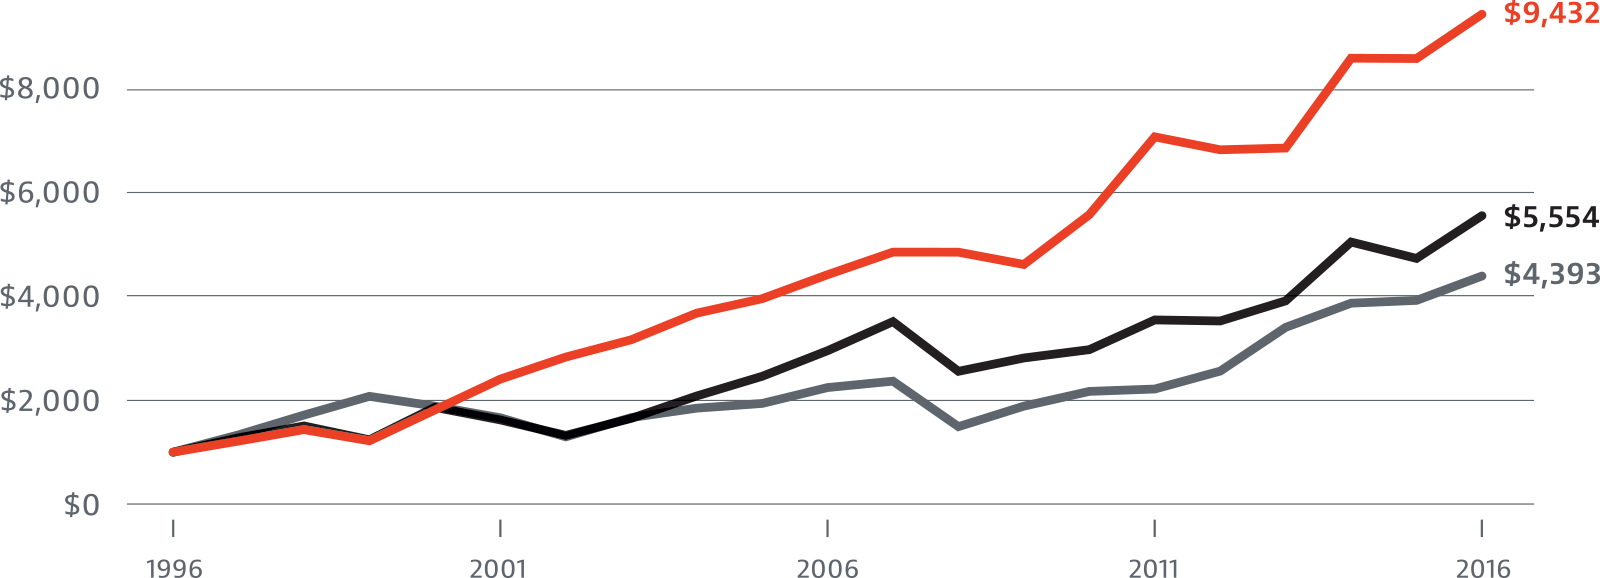
This performance graph compares the cumulative return on Southern Company (SO) common stock with the Philadelphia Electric Utility Index (UTY) and the Standard & Poor’s (S&P) 500 Index for the past 20 years. The average annualized return during the 20-year period is 11.9 percent for Southern Company, compared to 8.9 percent for the UTY and 7.7 percent for the S&P 500. The graph assumes that $1,000 was invested in Southern Company common stock and each of the above indices on December 31, 1996, and that all dividends were reinvested. A five-year performance graph is included in the Annual Report to Stockholders.
See Glossary for information on total shareholder return.
Source: FactSet and Bloomberg
SOUTHERN COMPANY DIVIDEND VALUE
SOUTHERN COMPANY STOCK VALUE
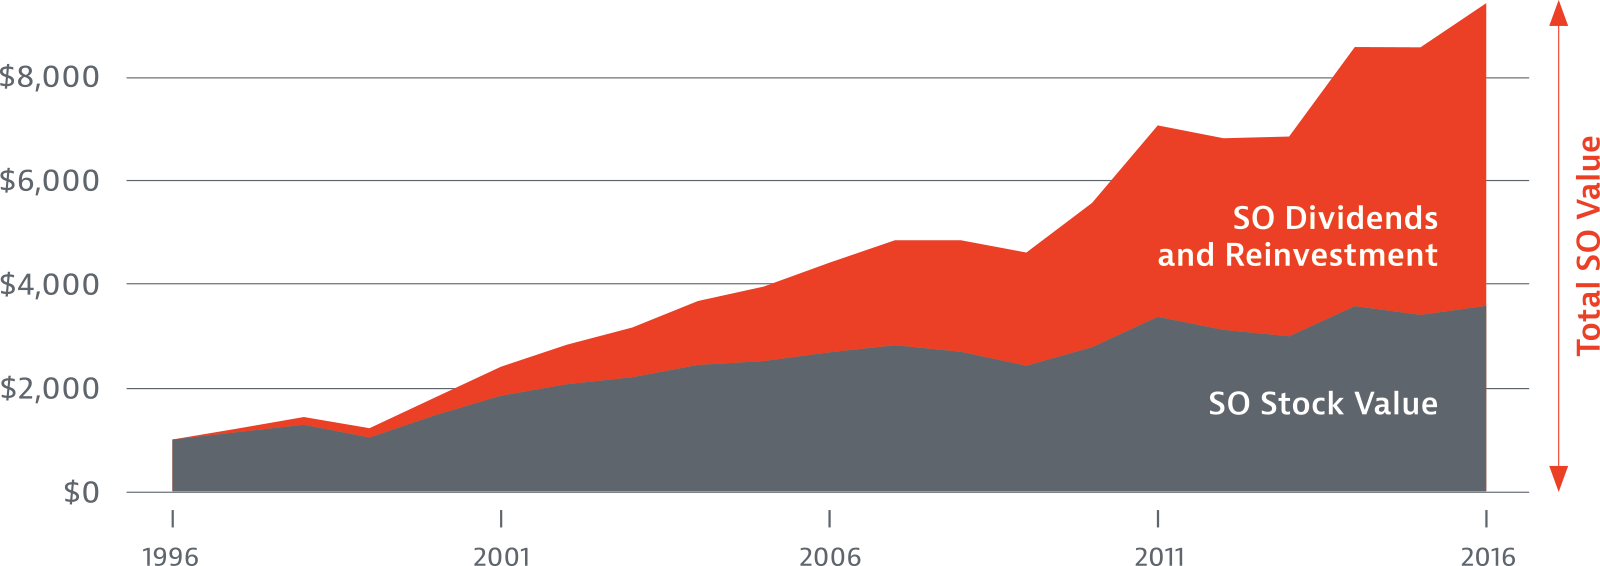
This chart shows the power of Southern Company’s dividend. Over the last 20 years, a $1,000 investment in Southern Company grew to $9,432. Price increases contributed $2,583 and dividends, with reinvestment, accounted for an increase of $5,849, or approximately 69 percent of the gain in value. The graph assumes that $1,000 was invested in Southern Company common stock on December 31, 1996, and that all dividends were reinvested.
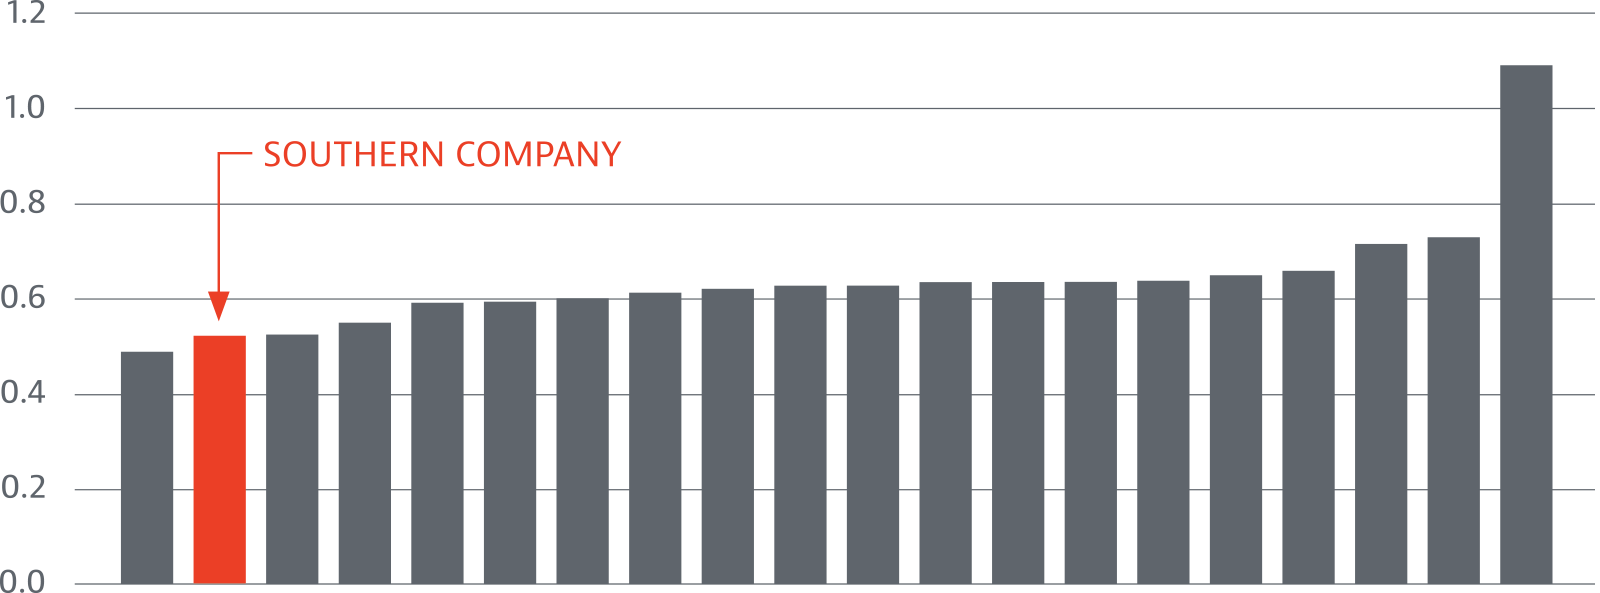
This chart shows the volatility of each of the 20 utilities in the Philadelphia Electric Utility Index (UTY). Volatility refers to the tendency of a stock to react to swings in the market. Southern Company had the second-lowest level of volatility in the UTY Index.
See Glossary for information on beta.
Source: FactSet and Bloomberg, five-year beta as of December 31, 2016